Interactive charts on Internet


The Internet’s history has just begun
The Internet’s history goes back some decades by now – email has been around since the 1960s, file sharing since at least the 1970s, and TCP/IP was standardized in 1982.
But it was the creation of the World Wide Web in 1989 that revolutionized our history of communication. The inventor of the World Wide Web was the British scientist Tim Berners-Lee who created a system to share information through a network of computers. At the time he was working for the European physics laboratory CERN in the Swiss Alps.
Here I want to look at the global expansion of the internet since then.
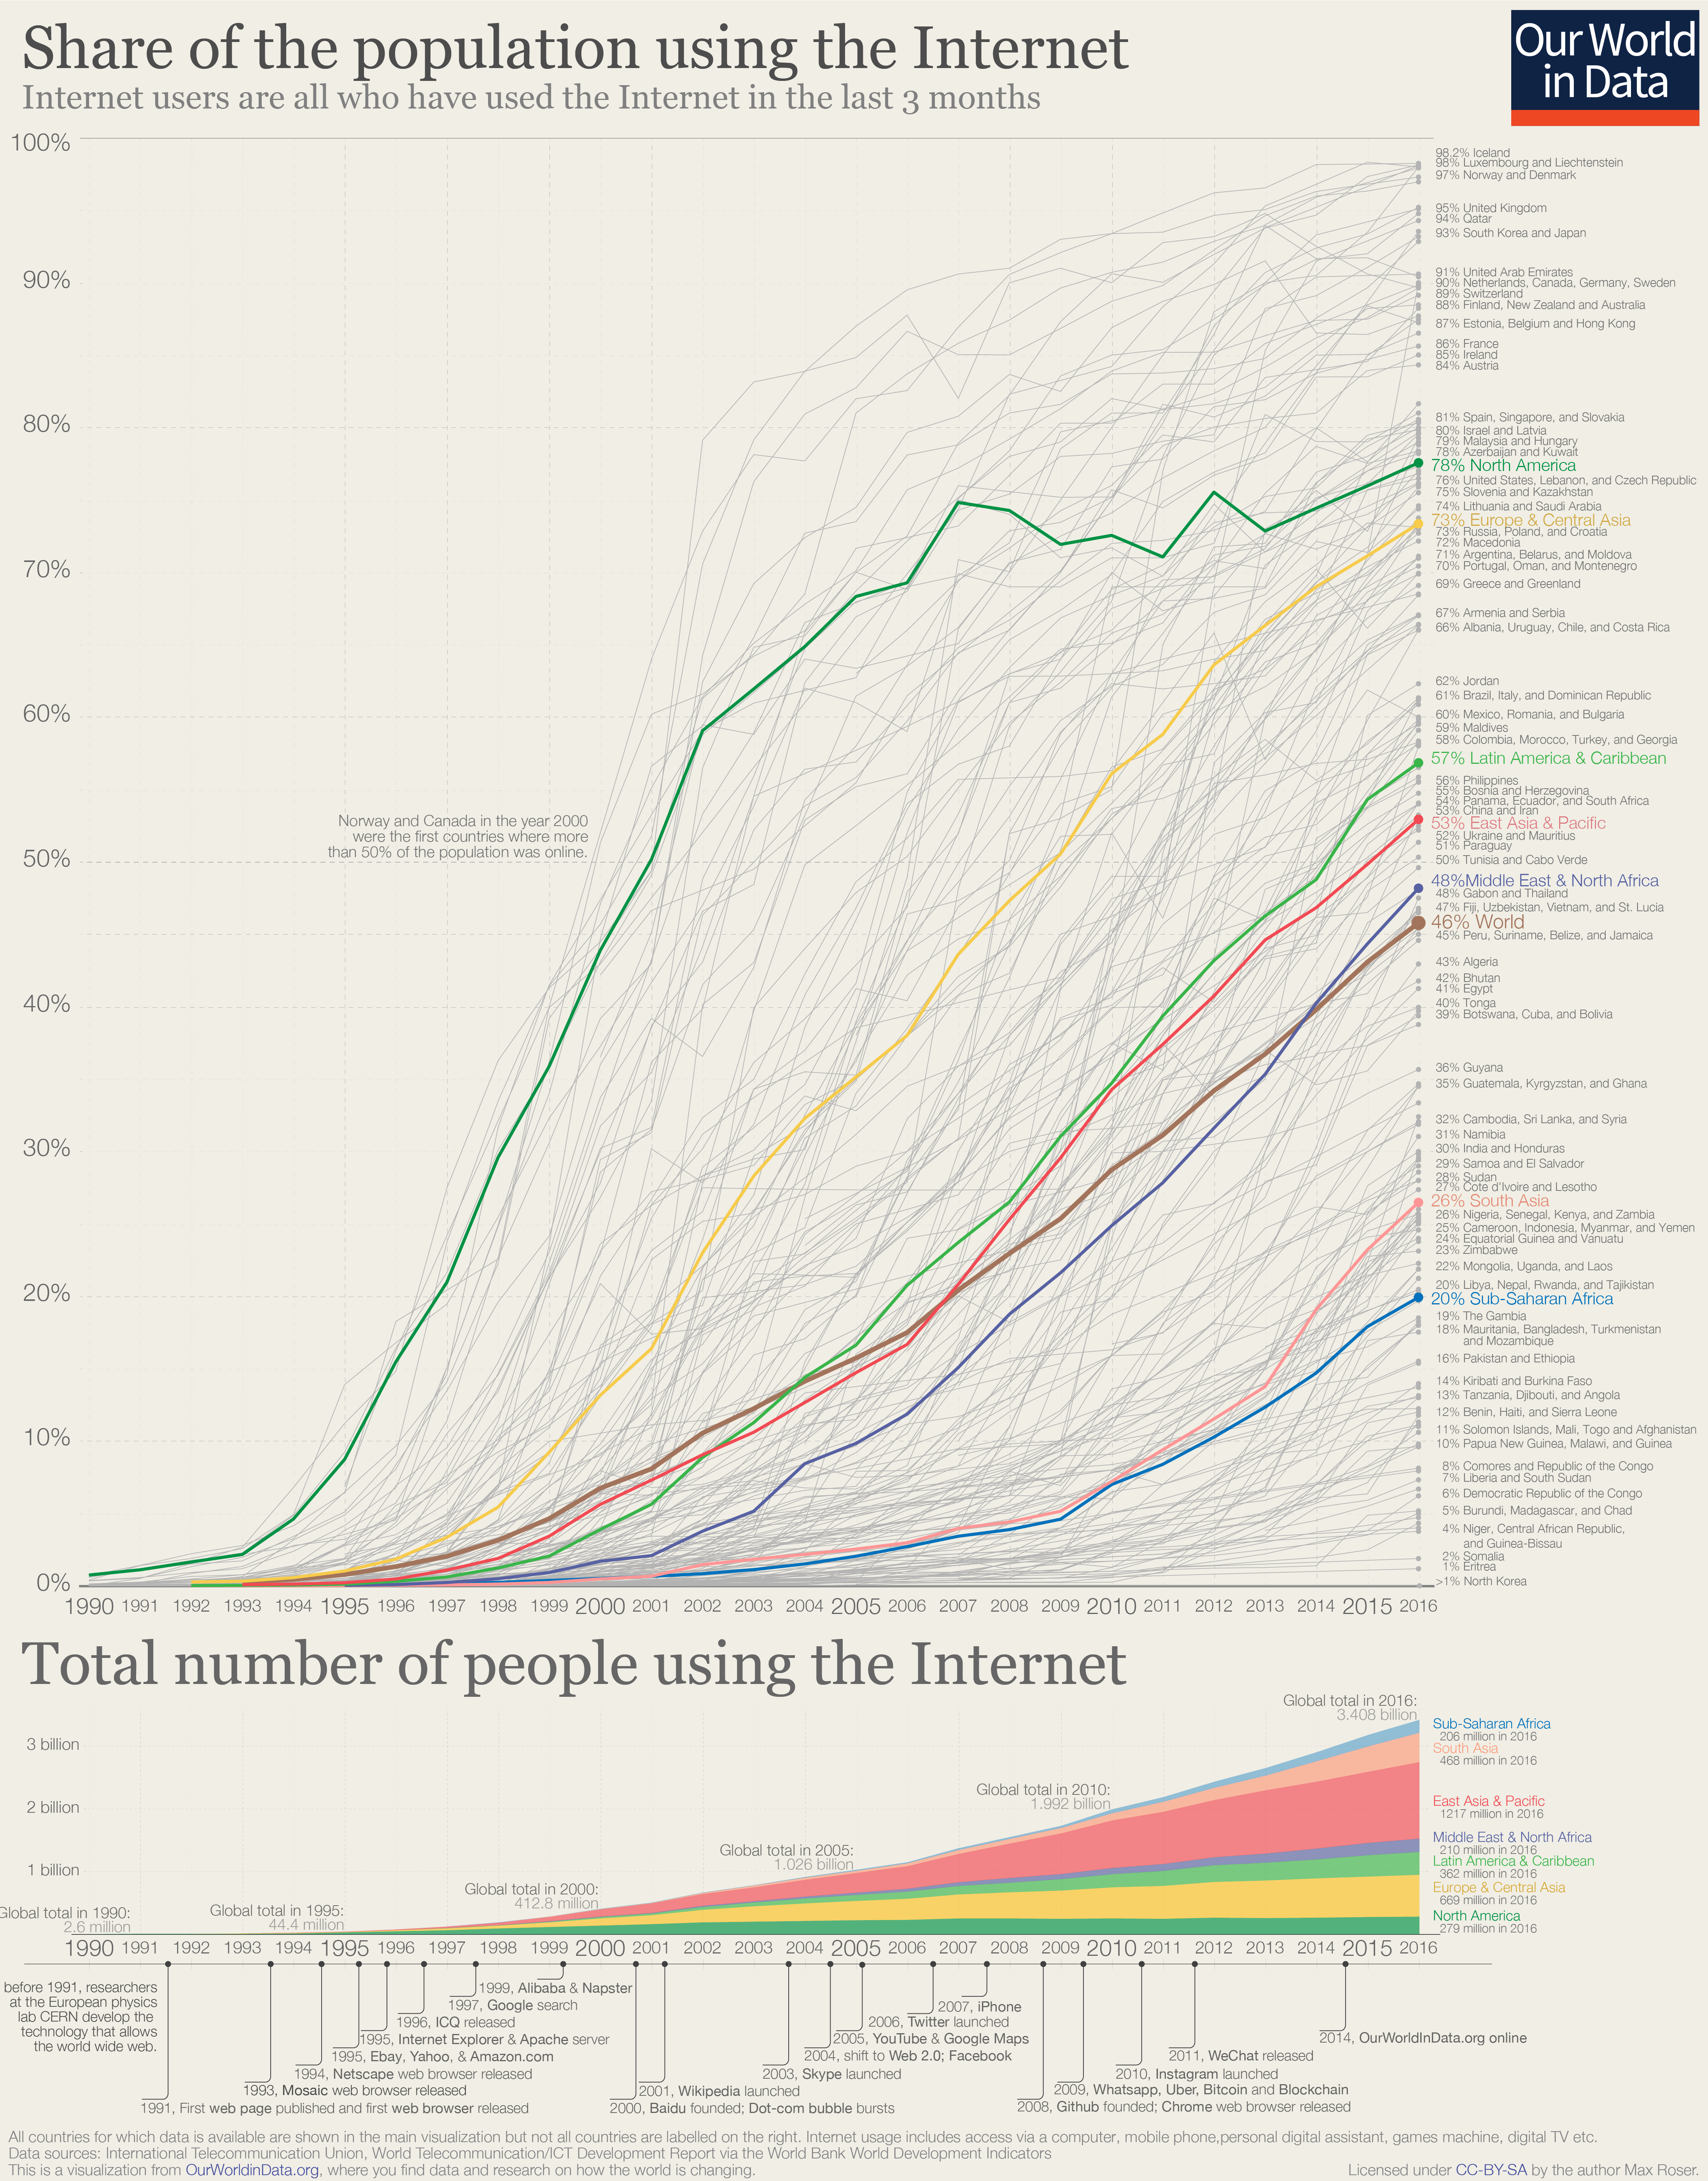
This chart shows the share and number of people that are using the internet, which in these statistics refers to all those who have used the internet in the last 3 months.1
You can also explore interactive versions of the chart with the most recent available global data.
The chart starts in 1990, still one year before Berners-Lee released the first web browser and before the very first website was online (the site of CERN, which is still online). At that time very few computers around the world were connected to a network; estimates for 1990 suggest that only half of a percent of the world population were online.
As the chart shows, this started to change in the 1990s, at least in some parts of the world: By the year 2000 almost half of the population in the US was accessing information through the internet. But across most of the world, the internet had not yet had much influence – 93% in the East Asia and Pacific region and 99% in South Asia and in Sub-Saharan Africa were still offline in 2000. At the time of the Dot-com-crash less than 7% of the world was online.
Fifteen years later, in 2016, three-quarters (76%) of people in the US were online and during these years countries from many parts of the world caught up: in Malaysia 79% used the internet; in Spain and Singapore 81%; in France 86%; in South Korea and Japan 93%; in Denmark and Norway 97%; and Iceland tops the ranking with 98% of the population online.2
At the other end of the spectrum, there are still countries where almost nothing has changed since 1990. In the very poorest countries – including Eritrea, Somalia, Guinea-Bissau, the Central African Republic, Niger, and Madagascar – fewer than 5% are online. And at the very bottom is North Korea, where the country’s oppressive regime restricts the access to the walled-off North Korean intranet Kwangmyong and access to the global internet is only granted to a very small elite.
But the overarching trend globally – and, as the chart shows, in all world regions – is clear: more and more people are online every year. The speed with which the world is changing is incredibly fast. On any day in the last 5 years there were on average 640,000 people online for the first time.3
This was 27,000 every hour.
For those who are online most days it is easy to forget how young the internet still is. The timeline below the chart reminds you how recent websites and technologies became available that are integrated to the everyday lives of millions: In the 1990s there was no Wikipedia, Twitter launched in 2006, and Our World in Data is only 4 years old (and look how many people have joined since then4).
And while many of us cannot imagine their lives without the services that the internet provides, the key message for me from this overview of the global history of the internet is that we are still in the very early stages of the internet. It was only in 2017 that half of the world population was online; and in 2018 it is therefore still the case that close to half of the world population is not using the internet.5
The internet has already changed the world, but the big changes that the internet will bring still lie ahead. Its history has just begun.
The map shows the share of the population that is accessing the internet for all countries of the world. Internet users are individuals who have used the Internet (from any location) in the last 3 months. The Internet can be used via a computer, mobile phone, personal digital assistant, games machine, digital TV etc.
In richer countries more than two thirds of the population are typically online. And although usage rates are much lower in the developing world, they are increasing.

The Internet has been one of our most transformative and fast-growing technologies. Globally, the number of Internet users increased from only 413 million in 2000 to over 3.4 billion in 2016. The one-billion barrier was crossed in 2005. Every day over the past five years, an average of 640,000 people went online for the first time.7
But how many people from each country are online? In the maps, we see the total number of users by country, and the percentage of a country’s population who are users.
China and India take the top two slots despite having only 50 and 26 percent online, respectively. The top six countries by users (and the only countries with over 100 million) in 2016/17 were8:
- China = 765 million
- India = 391 million
- United States = 245 million
- Brazil = 126 million
- Japan = 116 million
- Russia = 109 million
A chart of the top 10 countries is here. Clicking on any country in map shows how its users have changed over time.
The Internet has been growing at an incredible rate; many countries – including India, Bangladesh, Côte d’Ivoire, Ghana and Malawi – have doubled the number of users in the last 3 years alone.
Around half of the world is not yet online – as Max wrote, the internet’s history has only just begun, but with 27,000 new users every hour, many will experience it for the first time soon.

This chart shows the number of fixed broadband subscriptions per 100 people.
This refers to fixed subscriptions to high-speed access to the public Internet (a TCP/IP connection), at downstream speeds equal to, or greater than, 256 kbit/s.
Means of connection include cable modem, DSL, fiber-to-the-home, other fixed (wired)-broadband subscriptions, satellite broadband and terrestrial fixed wireless broadband. Excluded are subscriptions via mobile-cellular networks.

A truly disruptive technological development has been the rise of mobile phones. The interactive visualization shows the latest global data.
By changing to the chart view you can see that globally we only saw a very slow rise until the late 1990s and then a dramatically faster increase in mobile device subscriptions since the beginning of the 21st century.

- Data: Total Population (in number of people), Internet Users (per 100 people), Fixed (wired) broadband subscriptions (per 100 people), Mobile cellular subscriptions
- Geographical Coverage: Worldwide
- Time Span: Dependent on the metric set but mostly from 1980 or 1990 onwards
- Available at: data.worldbank.org